Subscriptions dashboard
The Subscriptions dashboard in Explore covers recurring revenue performance. It follows the standard four-part Explore layout — header metrics, trend chart, drilldown panel, data table — with metrics tuned to subscription dynamics.
Appears when a subscription datasource (Recharge) is connected.
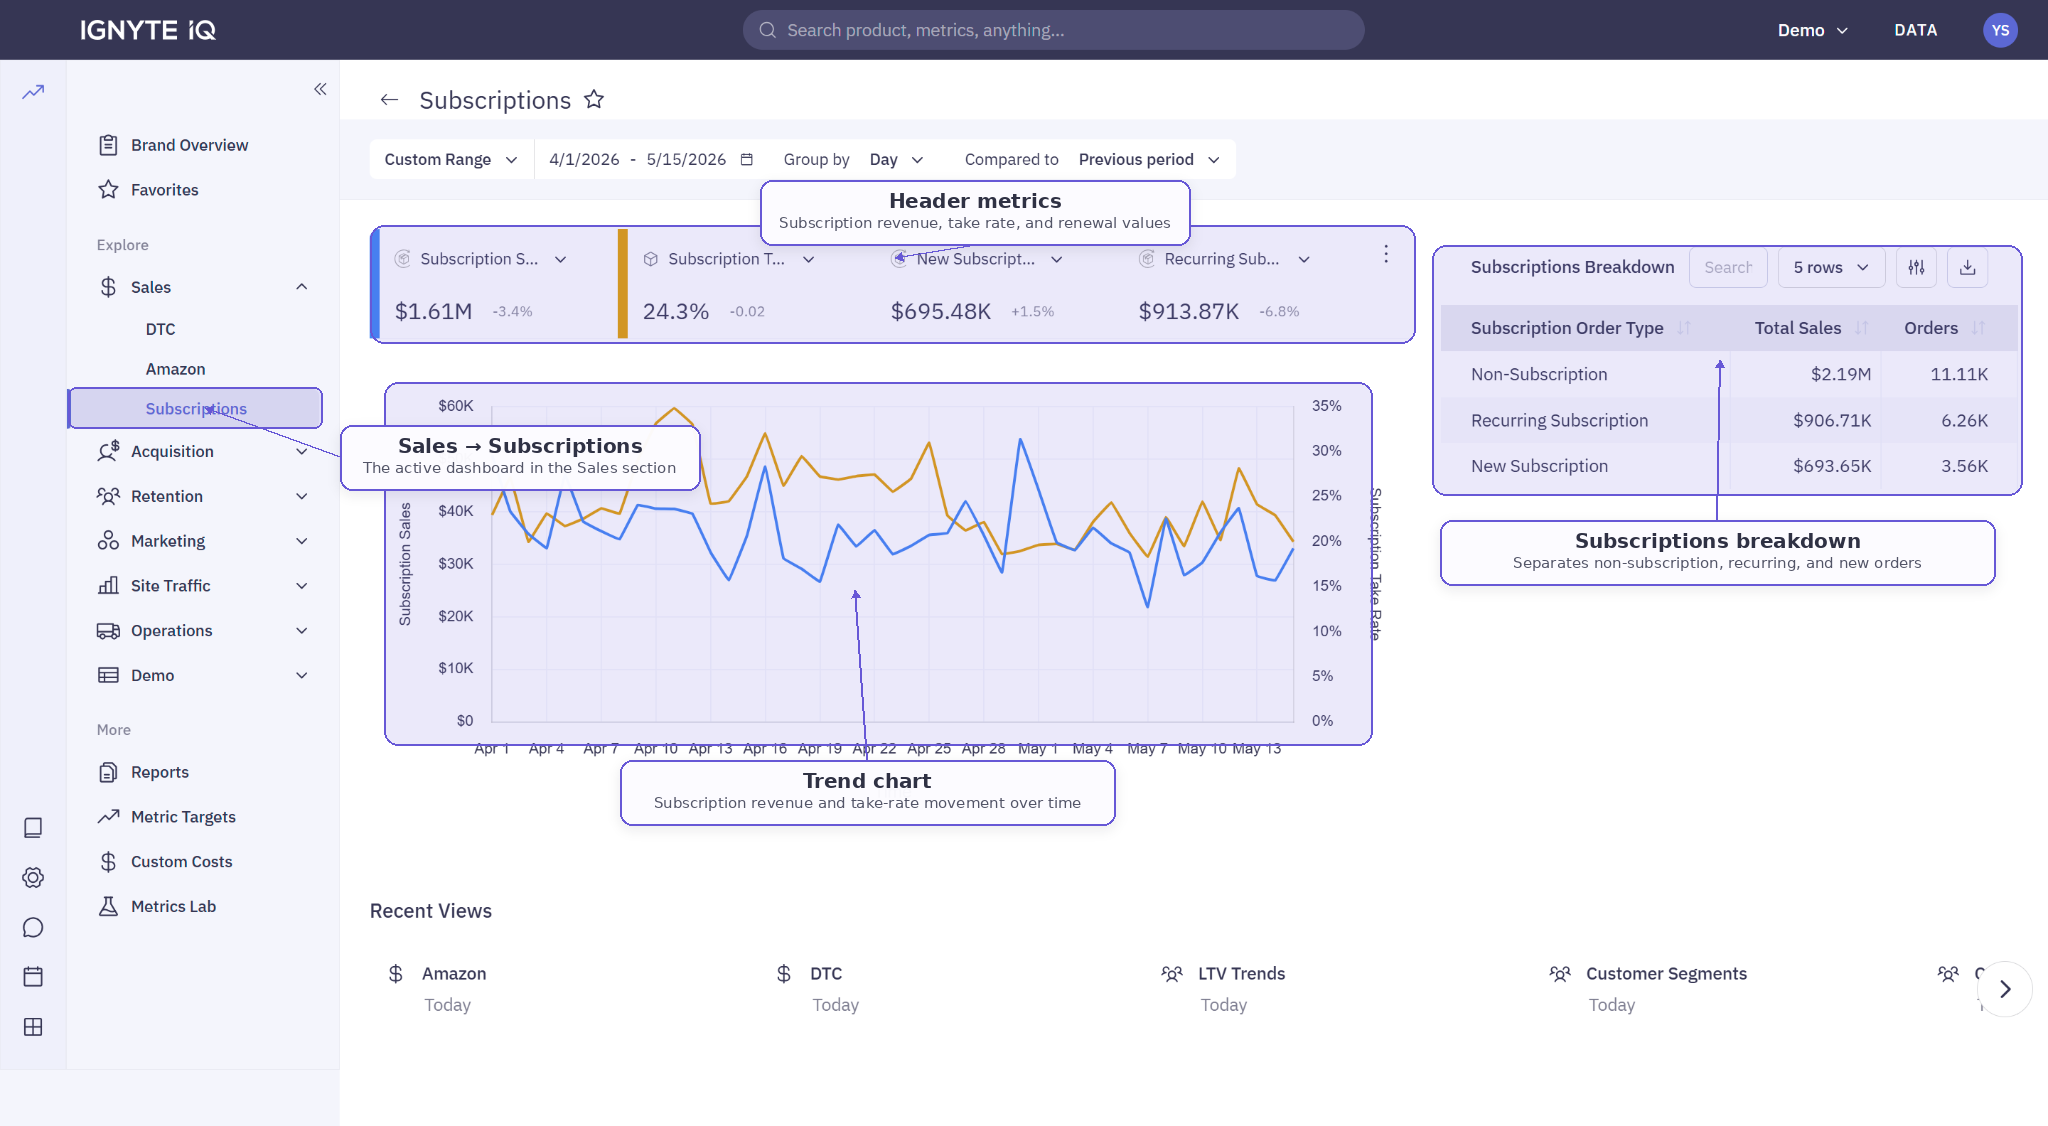
Header metrics
Section titled “Header metrics”Typical tiles:
| Tile | Description |
|---|---|
| Subscription Revenue | Revenue from subscription orders in the period |
| New Subscription Revenue | First-time subscription orders |
| Recurring Revenue | Renewal orders |
| Take Rate | Subscription share of orders or customers |
| Active Subscribers | Subscribers with at least one active subscription |
| MRR | Monthly Recurring Revenue (active subscriptions’ monthly value) |
| Churn Rate | Cancellations ÷ active subscribers at period start |
Trend chart
Section titled “Trend chart”Plots subscription revenue (or any other header metric) over time. Useful for spotting renewal cycles and churn events.
Subscription breakdown
Section titled “Subscription breakdown”A table typically separating one-time orders, new subscription orders, and renewals. Use for understanding the mix of new vs recurring revenue.
Common questions
Section titled “Common questions”Why are recurring sales higher than new subscription sales? Renewals are accumulating from prior periods. If new stays low for long periods, acquisition needs attention.
Where do I see individual subscribers? Subscriber-level detail typically lives in the Customers dashboard or in CSV exports.
Why don’t I see this dashboard? A subscription datasource isn’t connected in the current workspace.