The DATA panel
The DATA panel is a dropdown attached to the DATA button in the top header, accessible from every page. It lists every datasource connected to the current workspace along with each one’s Data Sync Status and the time of its last successful sync.
The DATA panel shows workspace-wide datasource health at a glance. For per-metric freshness, see the ℹ️ panel. For full datasource management (reauthorize, pause, delete, connect new), open Settings via the Manage Integrations → link at the bottom of the panel.
Opening the DATA panel
Section titled “Opening the DATA panel”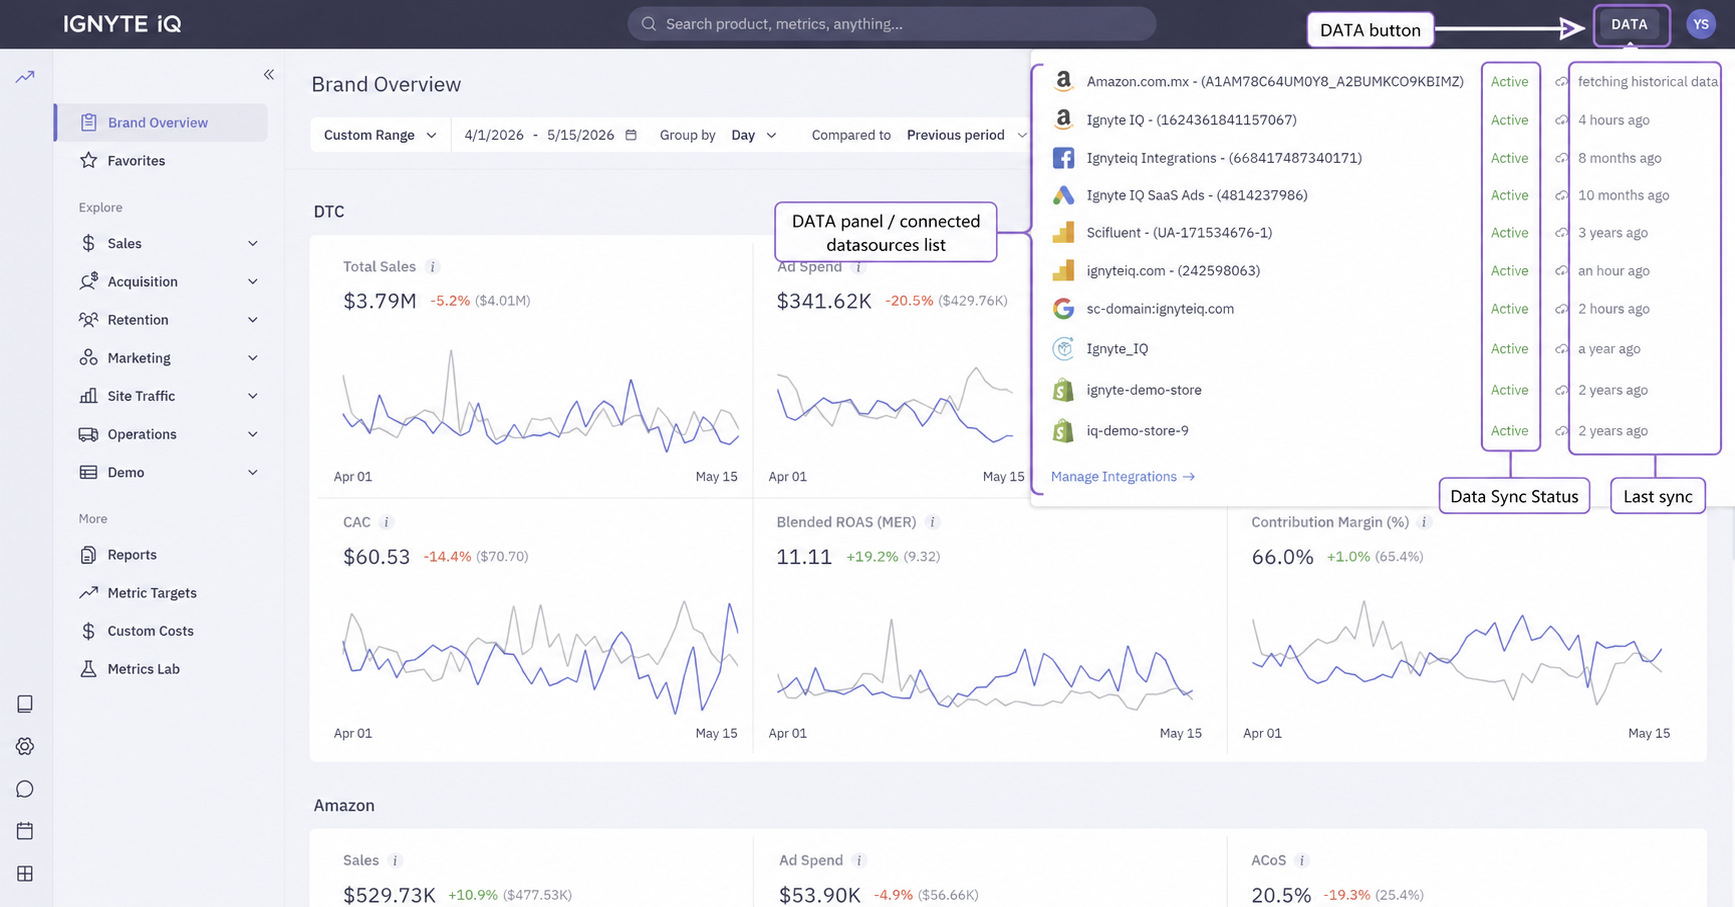
Click the DATA button in the top header. The dropdown lists every connected datasource in the current workspace.
What an entry looks like
Section titled “What an entry looks like”Each datasource entry in the dropdown shows four fields, laid out in a single row:
[ Shopify logo ] my-store.myshopify.com ● Active Last sync 4 hours ago- The platform logo and name identify the integration (Shopify, Google Ads, Klaviyo, etc.).
- The account or ID identifies the specific account this integration is bound to — a Shopify shop slug, a Google Ads account ID, an ad account name.
- The Data Sync Status badge shows the current state of the sync pipeline (values below).
- The last-sync timestamp is the time of the most recent successful sync, in relative format (“4 hours ago”, “8 months ago”).
What’s shown per datasource
Section titled “What’s shown per datasource”| Column | Contents |
|---|---|
| Platform | Datasource name (Shopify, Google Ads, Klaviyo, etc.) |
| Account / ID | The specific account this integration is bound to (e.g. a Shopify shop slug or a Google Ads account ID). |
| Data Sync Status | Current state of the sync pipeline (see below). |
| Last sync | Time of the most recent successful sync — relative format (“4 hours ago”, “8 months ago”). |
Data Sync Status values
Section titled “Data Sync Status values”| Status | Meaning |
|---|---|
| Active | Sync is running on its normal schedule. |
| Inactive | Sync is paused (via the Stop Data Sync action in the datasource detail panel, or platform-side). |
| Not synced | Connection exists but no sync has run yet — typical for a brand-new connection or one that hasn’t passed its first scheduled sync. |
| fetching historical data | The initial backfill is in progress. Larger stores can take hours; the workspace remains usable. |
Data Sync Status is one of two independent status fields a datasource carries. The other — Connection Status (Connected / Reauthorize) — covers authentication health and is visible in Settings → Integrations → Datasources rather than this header dropdown. See Integrations overview for the full model.
Manage Integrations link
Section titled “Manage Integrations link”The dropdown ends with a Manage Integrations → link that jumps to Settings → Integrations → Datasources — the full management surface where each datasource exposes its Connection Status, sub-account selector, audit trail, and actions (Reauthorize, Stop Data Sync, Delete).
Workspace scope
Section titled “Workspace scope”The DATA panel reflects the current workspace only. Switching workspaces changes the list of datasources shown.
Common questions
Section titled “Common questions”The DATA panel shows Active but a tile still looks stale.
The datasource is syncing, but the metric’s calculation step may not have caught up. Open the ℹ️ panel on the stale tile to see its calculation timestamp.
Why is “last sync” sometimes older than expected?
Each platform has its own sync cadence and rate limits. Hourly is typical; some platforms throttle at peak times.
Does opening the DATA panel trigger a sync?
No. The panel displays status only. To trigger a fresh sync, open the datasource detail in Settings → Integrations → Datasources.
A datasource expected to be in the workspace doesn’t appear.
Either the datasource isn’t connected in this workspace, or the current workspace differs from the one you intended to view. Confirm via the workspace selector.
Troubleshooting
Section titled “Troubleshooting”- Every datasource shows
Inactive— sync was paused workspace-wide. Re-enable each from Settings → Integrations → Datasources. - A datasource is stuck at
fetching historical datafor over a day — for stores with very large histories this is normal; for smaller stores, contact support. - Status is
Activebut the timestamp is hours old — the datasource may be rate-limited or backfilling. Check the detail panel for messaging.