Using the control bar
Every dashboard in Ignyte IQ — Brand Overview, every Explore dashboard, every Report — has the same control bar at the top. Changing any control recalculates every tile, trend chart, drilldown, and table on the page. The four controls are independent: changing one doesn’t reset the others.
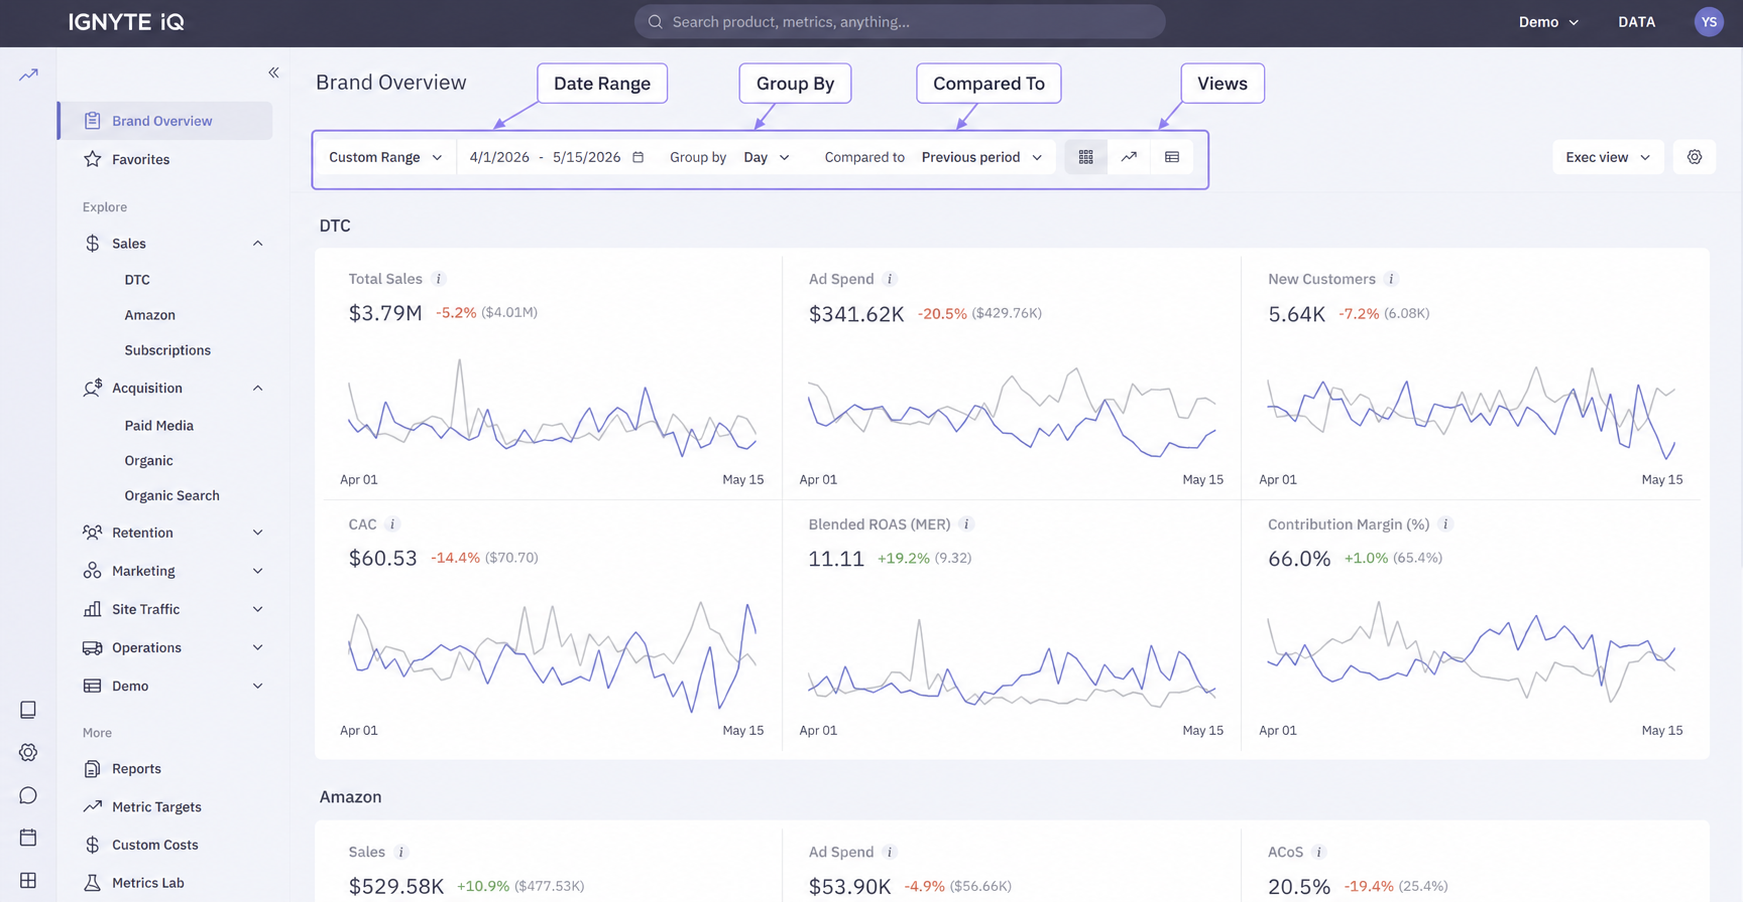
The four controls at a glance
Section titled “The four controls at a glance”| Control | Purpose |
|---|---|
| Date Range | Sets the period every tile reads from |
| Group By | Sets the granularity of trend charts (daily, weekly, monthly) |
| Compared To | Sets the comparison period (Previous Period, Same Period Last Year) |
| View selector | Save and reload a full control-bar configuration plus filters |
Tabs and filters layer on top of the control bar and recalculate the same way. See Working with data tables for table-level tabs and filters; the view selector is covered in Saved Views.
Date Range
Section titled “Date Range”The Date Range selector controls the time window the entire dashboard reads from.
Presets
Section titled “Presets”| Preset | Period |
|---|---|
| Today | The current day so far |
| Yesterday | The previous complete day |
| Last 7 days | Last 7 complete days |
| Last 30 days | Last 30 complete days |
| Month to date | First of the current month through today |
| Quarter to date | First of the current quarter through today |
| Year to date | January 1 through today |
| Custom | Any explicit start and end date |
When to use what
Section titled “When to use what”- Daily check-ins — Yesterday (complete day, easy to verify).
- Operational weekly — Last 7 days with Previous Period comparison.
- Monthly reviews — Month to date during the month, Custom (full prior month) for closing reviews.
- Year-over-year — any range with Same Period Last Year comparison.
Partial periods
Section titled “Partial periods”When the date range includes the current day, the dashboard reflects partial-day data. Comparing a partial period to a complete one produces misleading deltas — use complete periods (e.g. Yesterday vs Previous Period) when comparison matters.
Group By (time granularity)
Section titled “Group By (time granularity)”Group By sets the granularity at which trend charts roll up data — Day, Week, or Month. The headline tile uses the full date range and doesn’t change with Group By; only the trend chart’s bucket size changes.
Effect on calculated metrics
Section titled “Effect on calculated metrics”For calculated metrics (AOV, ROAS, CPA, Conversion Rate), each bucket on the trend chart applies the formula to that bucket’s totals — not the average of finer-grained values. See How metrics are calculated.
When to switch granularity
Section titled “When to switch granularity”- Day — diagnosing specific events; spikes and dips localize to a single point.
- Week — noisy data or weekday/weekend cycles; the cycle smooths out, the trend becomes legible.
- Month — long-term trends; use with date ranges of 6 months or more.
Compared To (comparison modes)
Section titled “Compared To (comparison modes)”Compared To sets which period a dashboard’s percentage deltas are calculated against.
Available modes
Section titled “Available modes”| Mode | What it compares |
|---|---|
| Previous Period | Equal-length period ending the day before the current range starts |
| Same Period Last Year | Same calendar dates one year prior |
| No comparison | Hides delta values; only absolute numbers shown |
When to use which
Section titled “When to use which”- Previous Period — day-over-day, week-over-week. Best for short cycles and operational reporting.
- Same Period Last Year — annual reviews and seasonality-sensitive metrics (holiday sales, summer cycles); year-over-year growth.
- No comparison — when comparison would mislead (e.g. partial-period vs complete-period).
Partial-period comparison caveat
Section titled “Partial-period comparison caveat”Comparing an incomplete period (today, partial-month) to a complete one produces deltas that aren’t meaningful. Either use complete periods on both sides, or compare today to the equivalent partial period prior.
View selector
Section titled “View selector”The view selector saves and reloads a full control-bar configuration — date range, comparison, group-by, filters, and active tab — for one-click reuse later. Workspace-shared on every dashboard. See Saved Views for create / update / share mechanics.
Common questions
Section titled “Common questions”Changing the date range resets the comparison. The four controls are independent. If the comparison appears to reset, it’s because the previous comparison wasn’t valid for the new range (e.g. Same Period Last Year on a date range that includes today).
Group By is greyed out. The current date range is too short to support the selected granularity. Weekly needs at least two complete weeks; Monthly needs at least two complete months. Expand the date range.
Deltas show as — instead of a percentage.
The comparison period has no data (e.g. the workspace wasn’t connected to its datasources yet). Pick a more recent comparison or switch to No comparison.