Paid Media dashboard
The Paid Media dashboard rolls up every connected ad platform into one cross-platform view. It follows the standard four-part Explore layout — header metrics, trend chart, drilldown panel, data table. Metrics use platform-reported attribution — each ad platform’s own model and lookback window.
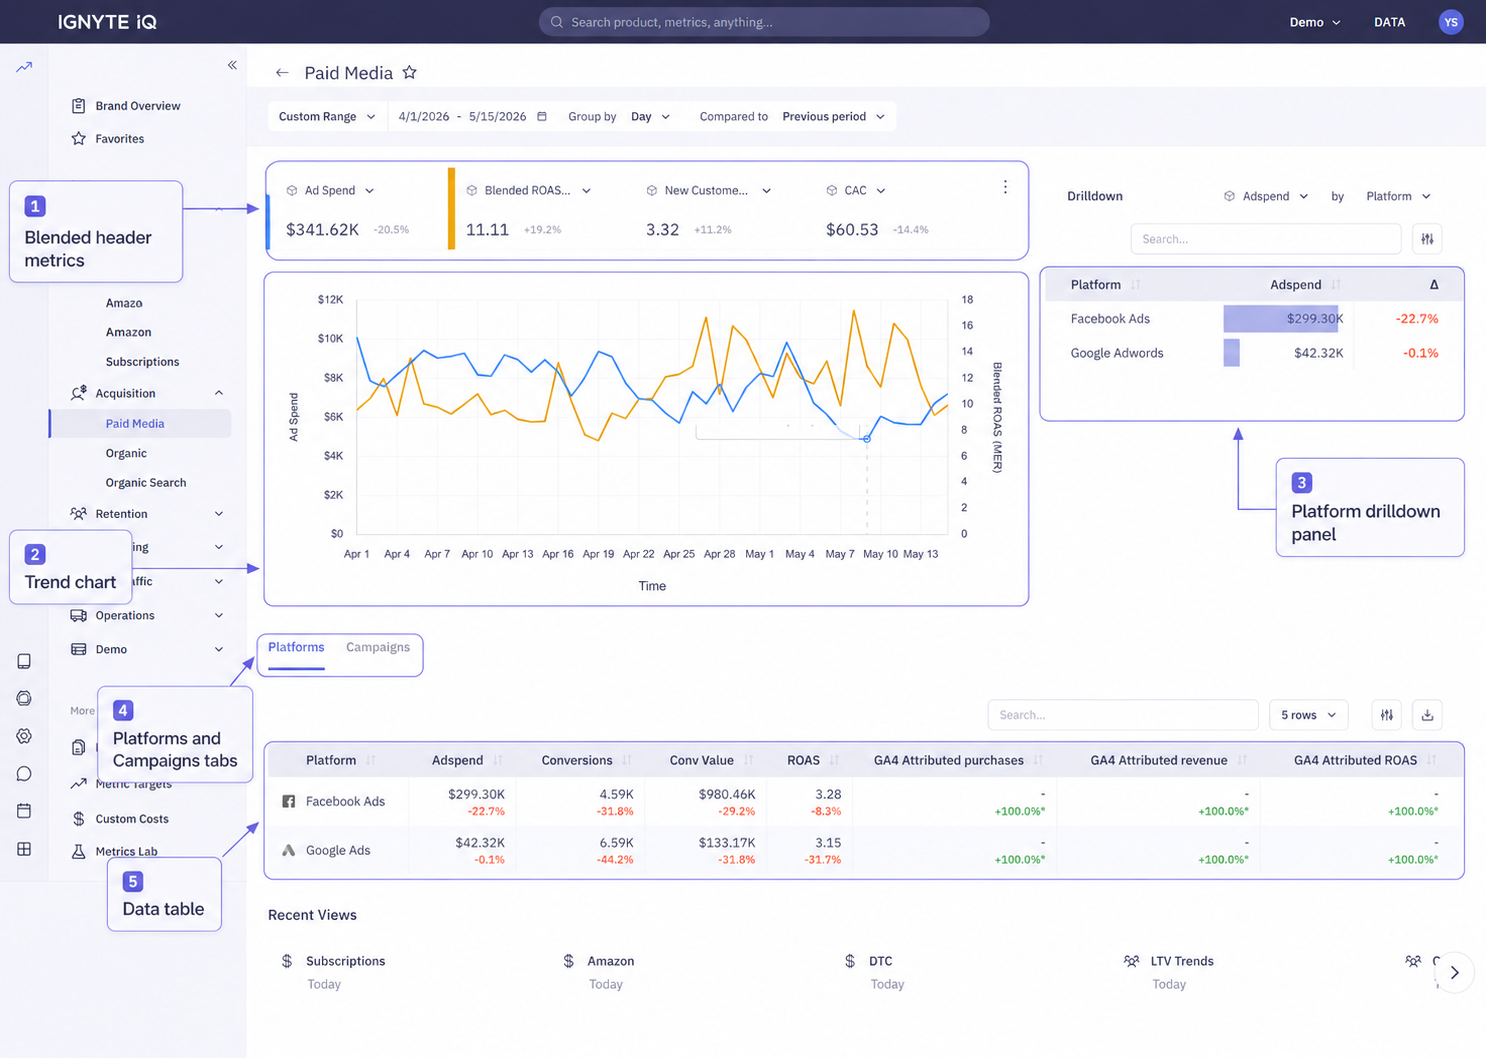
Header metrics
Section titled “Header metrics”Blended across every connected ad platform:
| Tile | Description |
|---|---|
| Total Spend | Combined spend across platforms |
| Blended ROAS | Revenue ÷ total spend |
| Blended CPA | Spend ÷ conversions |
| Conversions | Total conversion count |
| Revenue from Ads | Attributed revenue |
Each platform contributes its own platform-reported conversions and attributed revenue, blended into the totals.
Attribution basis
Section titled “Attribution basis”Paid Media uses platform-reported attribution: every platform’s numbers come from that platform’s own attribution model and lookback window. Because the models differ, a platform’s contribution here matches its own ad manager — not GA4.
- For how Facebook’s window shapes its numbers, see Facebook attribution windows.
- For reconciling ad-platform numbers against GA4, see Why numbers don’t match.
Trend chart
Section titled “Trend chart”Plots a selected blended metric over the date range at the current Group By granularity.
Drilldown panel
Section titled “Drilldown panel”Ranks ad platforms by the selected metric. Defaults to spend.
Platforms vs Campaigns tabs
Section titled “Platforms vs Campaigns tabs”Tabs above the data table switch between aggregation levels:
| Tab | Contents | Use for |
|---|---|---|
| Platforms | One row per ad platform | Budget allocation and platform-level comparison — “which platform should we scale or cut?” |
| Campaigns | Campaign-level detail across all platforms | Tactical campaign-level analysis — “which campaigns are working within each platform?” |
Date range and filters apply to both tabs. Only the table’s grouping changes.
Per-platform deep dive
Section titled “Per-platform deep dive”For platform-specific dashboards (Google Ads, Meta, TikTok, Pinterest, Microsoft, Amazon Ads), see the Marketing section.
Common questions
Section titled “Common questions”Blended ROAS differs from per-platform ROAS.
Blended ROAS combines every platform’s spend and platform-reported revenue; a single platform’s dashboard shows only its own slice. The blended figure also dilutes a strong platform with weaker ones.
Why don’t these numbers match GA4?
Each platform reports under its own attribution model and window; GA4 applies a different model. The gap is expected — see Why numbers don’t match.
Troubleshooting
Section titled “Troubleshooting”- No conversions — confirm conversion tracking is configured on the ad platforms and that each is connected via the Data panel.
- Blended ROAS looks too high versus GA4 — platform-reported attribution often includes view-through and longer windows than GA4. The gap is informational, not a sync issue.
- Some platforms missing from the drilldown — confirm each ad platform is connected via the Data panel.