DTC dashboard
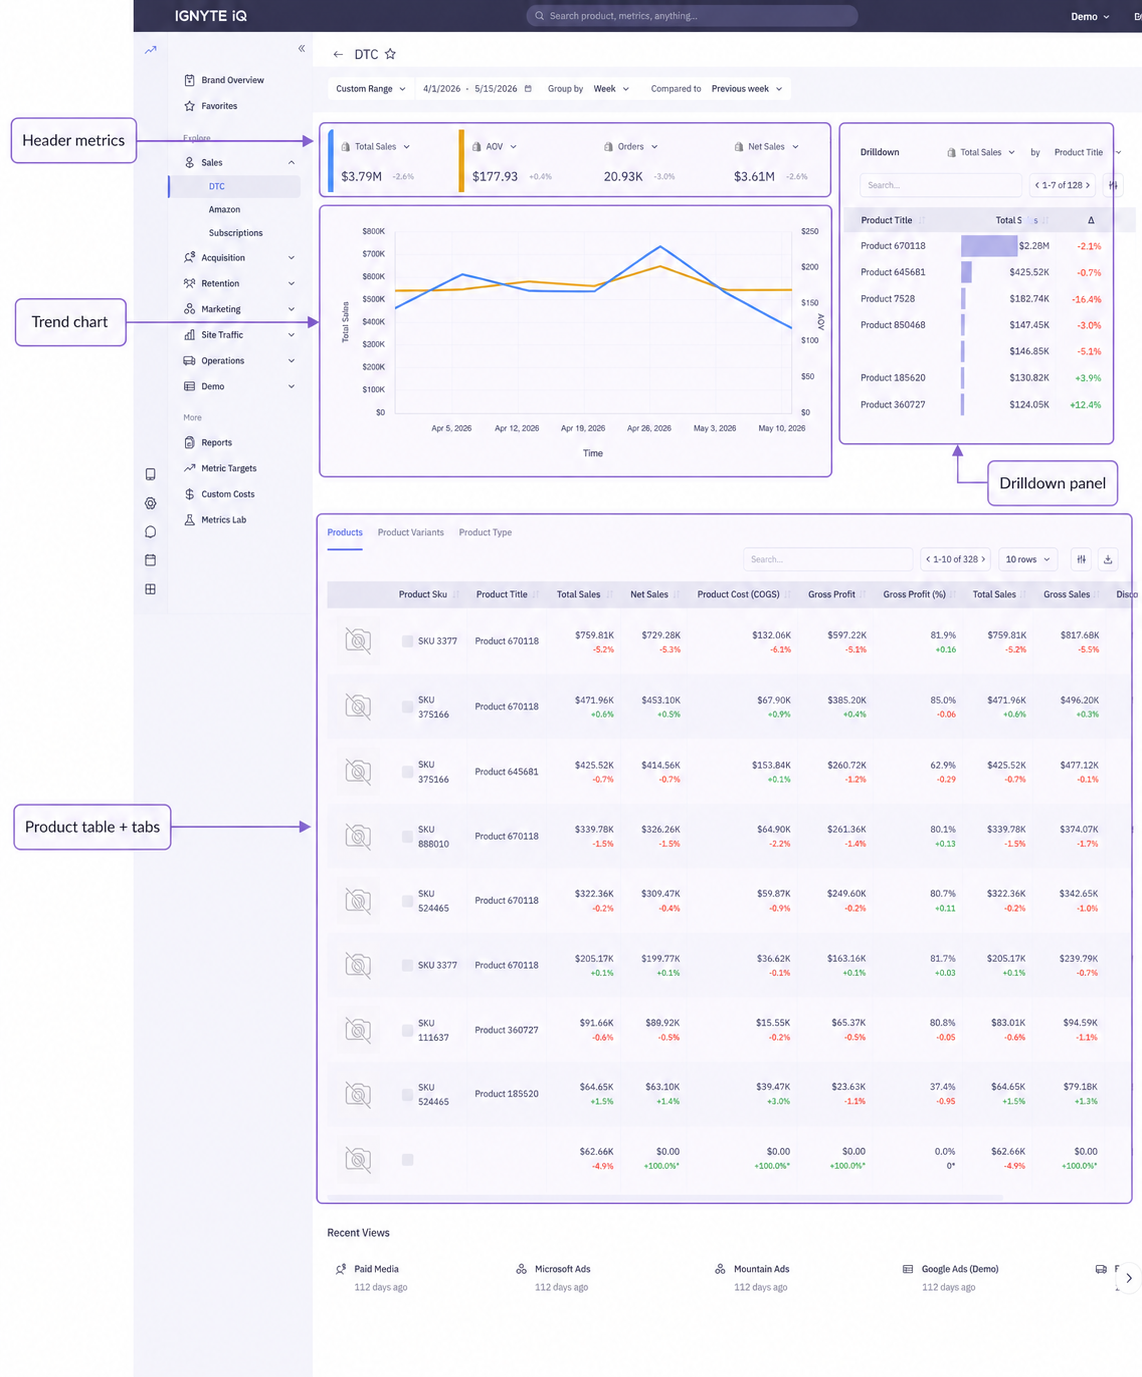
The DTC dashboard in Explore covers direct-to-consumer performance from the ecommerce datasource connected to the workspace (Shopify, BigCommerce, or WooCommerce). It follows the standard four-part Explore layout — header metrics, trend chart, drilldown panel, data table.
For the layout pattern, see Reading an Explore dashboard.
Header metrics
Section titled “Header metrics”Typical tiles include:
| Tile | Description |
|---|---|
| Gross Sales | Product revenue before deductions |
| Net Sales | Revenue after refunds and discounts |
| Orders | Order count |
| AOV | Average order value (Net Sales ÷ Orders) |
| Refund Rate | Refunded revenue ÷ Gross Sales |
| New Customers | First-time purchasers in the period |
| Returning Customers | Repeat purchasers in the period |
The exact set varies by workspace. Each tile’s definition appears in its ℹ️ panel.
For the definitions of revenue metrics, see Revenue metrics.
Metric selector pills
Section titled “Metric selector pills”Above the trend chart, a row of metric selector pills lets the chart focus on one or two of the header metrics at a time — clicking a pill toggles that metric on or off the chart. Common pairings: Gross Sales + Orders to see whether revenue moves with volume, or Net Sales + Refund Rate to see whether discounting is offsetting a refund spike.
The pills don’t change the header tiles or the table — only the trend chart.
Trend chart
Section titled “Trend chart”Plots the selected header metric(s) over the date range at the chosen Group By granularity. The pills above control which metrics are plotted.
Drilldown panel
Section titled “Drilldown panel”Defaults to products ranked by Gross Sales. The ranking metric and breakdown dimension are changeable via the dropdown at the top of the panel.
Product table and tabs
Section titled “Product table and tabs”Tabs above the table switch between breakdown levels:
| Tab | Contents |
|---|---|
| Products | Each unique product (master record) |
| Variants | Each SKU/variant |
| Product Types | Grouped by Shopify’s product_type |
| Vendor | Grouped by Shopify’s vendor |
Header metrics and trend chart remain unchanged across tabs. Only the table changes.
Filters
Section titled “Filters”Filters appear above the table or as a separate control. Filters apply to the entire dashboard — headers, trend chart, drilldown, and table all recompute together.
Exporting
Section titled “Exporting”The data table includes an export action. See Exporting data from Sales tables.
Common questions
Section titled “Common questions”Numbers don’t match Shopify Admin.
Differences typically reflect date anchor or definition variations. See Why numbers don’t match and the canonical Shopify Sales vs Order closed date.
Profitability per product isn’t shown.
Profitability metrics require uploaded COGS via the Custom costs CSV datasource. See Custom costs (CSV upload).
Where does Amazon data appear?
Amazon has its own dashboard. See Amazon dashboard.
Troubleshooting
Section titled “Troubleshooting”- No data on the dashboard — confirm the ecommerce datasource is connected and synced via the Data panel.
- Tables are empty while headers show values — filters may exclude all rows. Reset filters.
- Drilldown and table show different top items — they may use different sort metrics. Confirm both are sorted by the same field.