Brand Overview
Brand Overview is the default landing dashboard in Ignyte IQ. It displays summary metrics across the workspace’s connected datasources, grouped into themed sections — DTC, Marketplaces, Marketing, Retention, Site Traffic, Operations, and Subscriptions.
Brand Overview is view-based: every visit opens a saved configuration of date range, comparison, channel chips, and section layout. The workspace ships with a default view tuned to the primary platform picked at workspace creation; teams add their own views for specific reading patterns (e.g. Weekly Exec Read, DTC-only Yesterday, Holiday War Room). The view selector in the control bar switches between them.
The sections that appear in any view depend on which datasources are connected to the workspace.
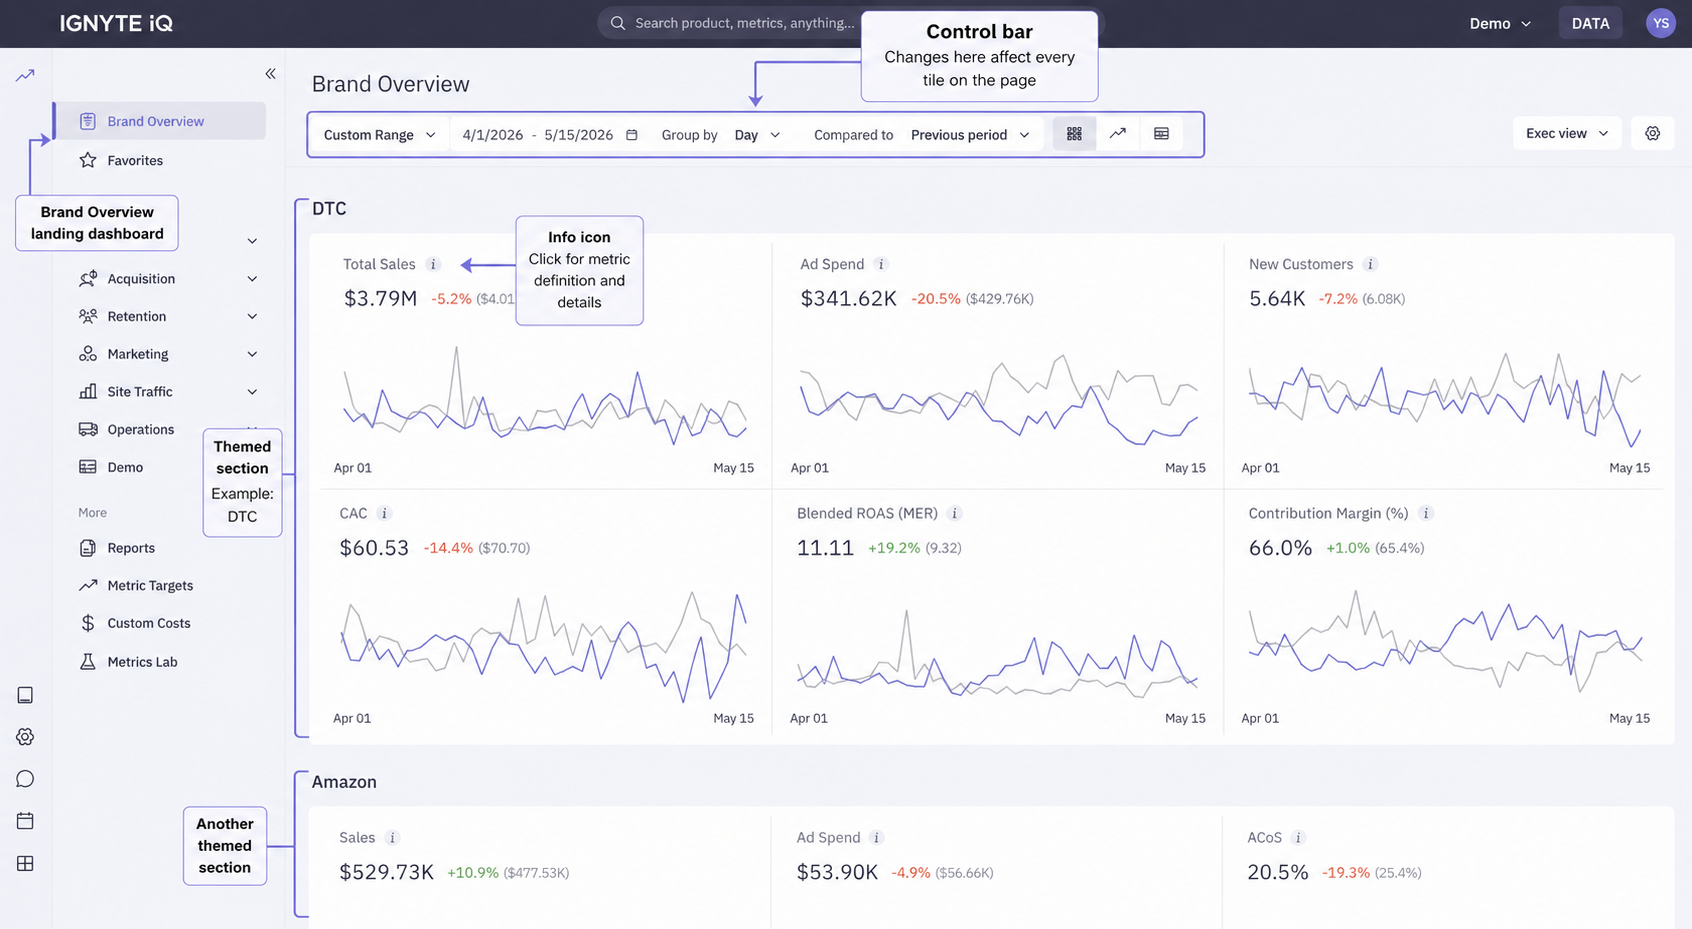
Page anatomy
Section titled “Page anatomy”| Layer | Contents |
|---|---|
| Control bar | Date Range, Group By, Compared To, and the view selector. Each control affects every tile on the page. |
| Channel filter chips | DTC, Marketplaces, Marketing Platforms, and others depending on connected datasources — chips in the control bar that refilter the entire page (not table tabs). |
| Themed sections | Metric tiles grouped by topic — DTC, Marketplaces, Marketing, Retention, Site Traffic, Operations, Subscriptions. |
| Product tables | Ranked tables of top items (DTC and Amazon separately when both are connected). |
Sections and their datasources
Section titled “Sections and their datasources”| Section | Required datasource |
|---|---|
| DTC | Ecommerce (Shopify, BigCommerce, WooCommerce) |
| Marketplaces | Amazon Seller |
| Marketing | One or more ad platforms |
| Retention | Klaviyo (for messaging-related views); ecommerce for repurchase metrics |
| Site Traffic | Google Analytics 4 |
| Operations | Ecommerce datasource with fulfillment data |
| Subscriptions | Recharge |
For details on each section’s contents, see Brand Overview sections.
A view is a saved configuration — date range, comparison, channel filter chips, and section layout — that Brand Overview opens to with one click.
- Views on Brand Overview — the view model and when to add a new one.
- The default Brand Overview view — what ships out of the box and how the primary-platform choice shapes it.
- Create a Brand Overview view — the steps to save and share a view.
Reading a metric tile
Section titled “Reading a metric tile”Each tile shows a headline value, a trend chart, and an ℹ️ icon. See Reading metric tiles for the field-by-field breakdown.
Common questions
Section titled “Common questions”Why are the same metric’s values different between Brand Overview and Explore?
The two surfaces have independent control bars. Confirm the date range, comparison, and any filters match on both before treating the difference as a data issue.
Can sections be customized or reordered?
Section order is consistent across views; visibility depends on which datasources are connected and which channel chips a view has selected. For a fully custom layout that mixes and matches sections, see Reports.
Where does a view live?
Saved views are workspace-scoped — every member of the workspace can switch to any view. See Create a Brand Overview view for the mechanics.
Can Brand Overview show data from multiple workspaces?
No. Brand Overview shows the current workspace only. Enterprise plans may have multi-brand rollup workspaces — contact support if applicable.